A clearer picture of your events
A dedicated insights surface for partners. Track revenue, attendance, audiences, and channel performance in real time across every event.

The core reports, in depth
A separate surface to look at performance, not a tab inside the App, where the work of running events is enough. Designed for planning, comparing, and learning.
- 01
Financial reports
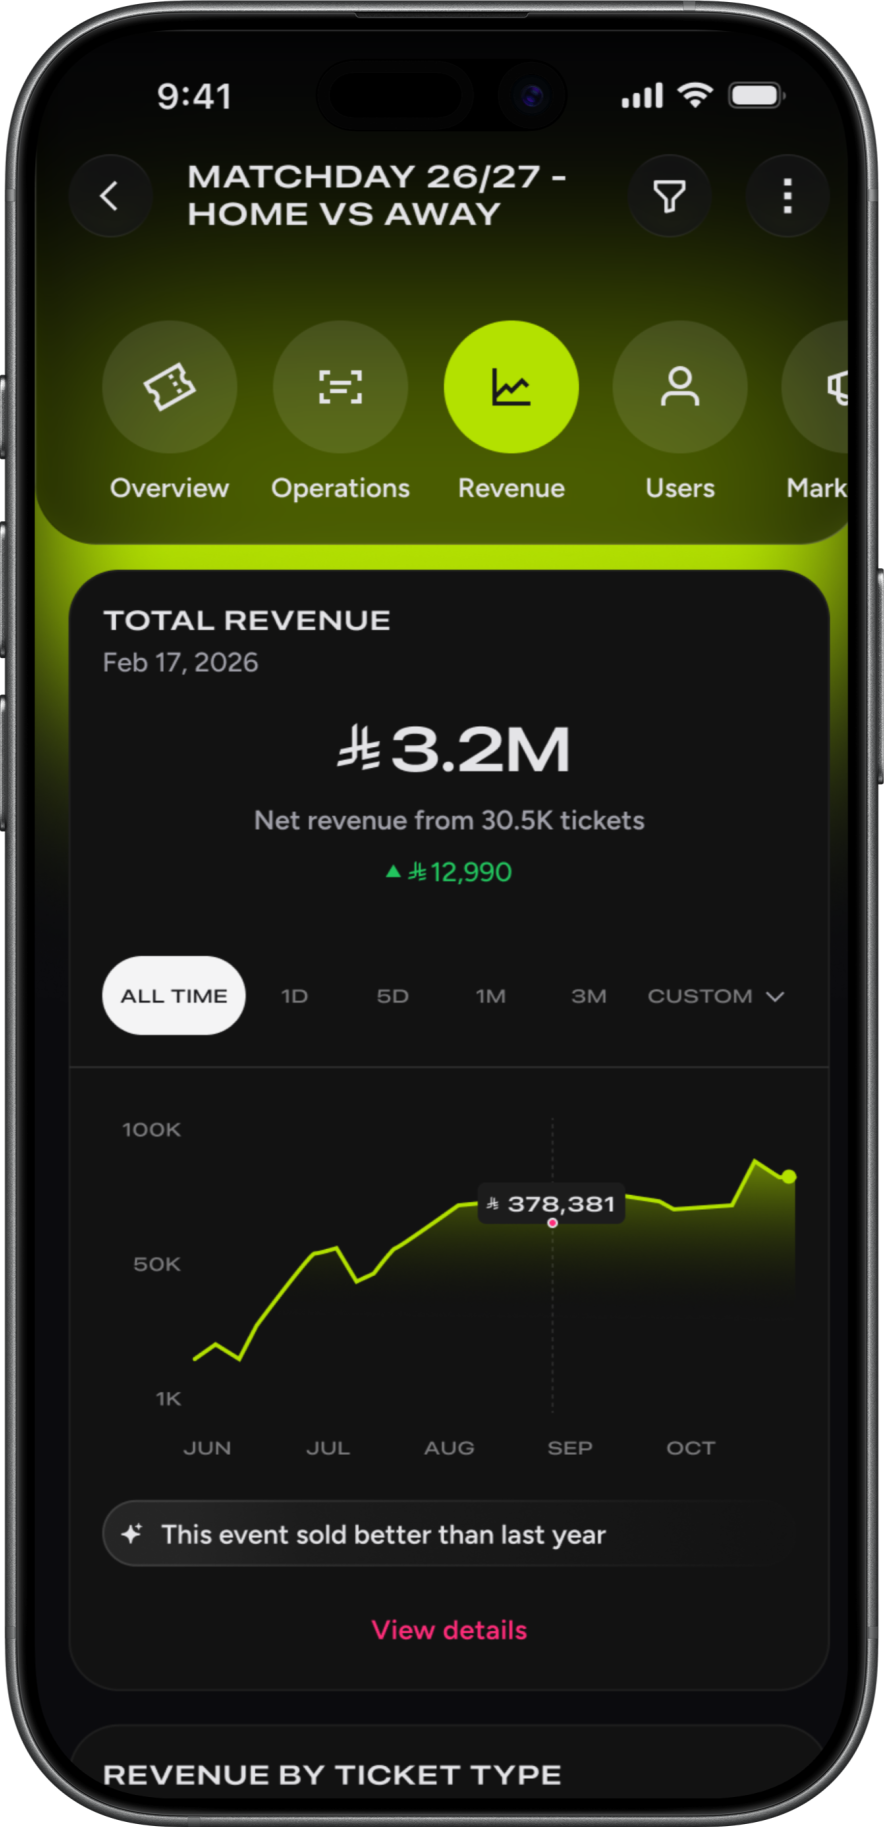
Gross revenue, net revenue, fees, refunds, and payouts broken down by event, edition, or date range.
- 02
Attendance reports
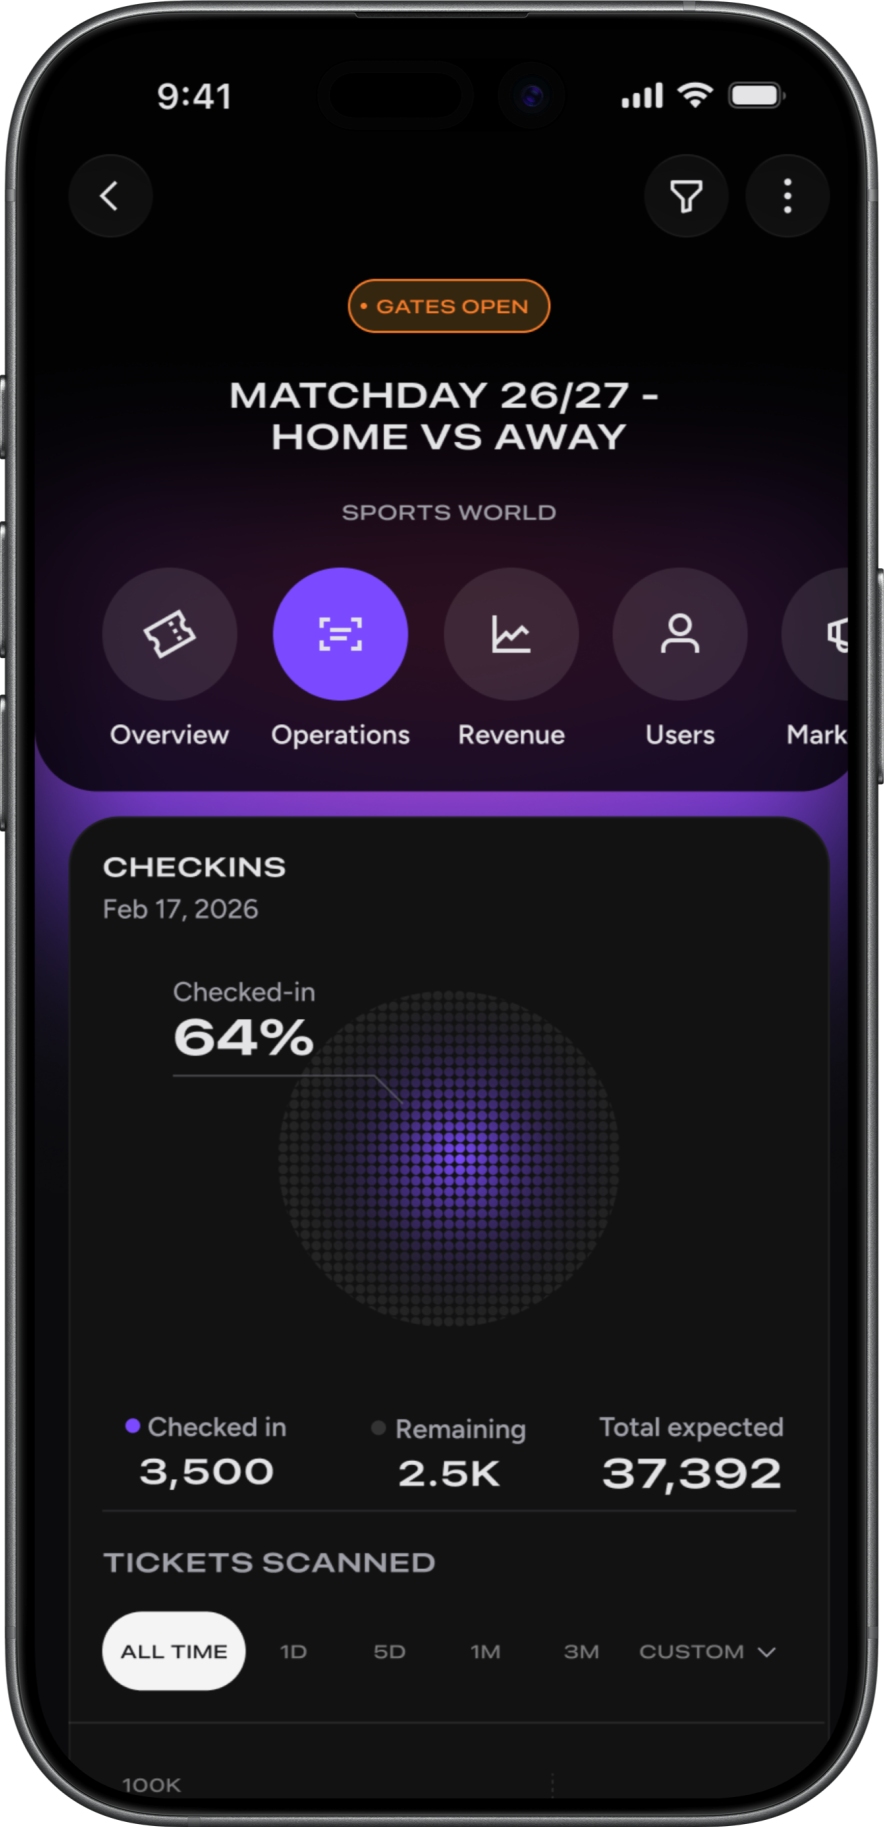
Live gate check-ins, congestion by entrance, and capacity utilization mapped across the venue.
- 03
Distribution breakdown
Where every ticket came from: invitations, online, and offline, measured against total capacity.
- 04
Edition comparison
This year vs last year, edition over edition: see how the same event is tracking against its past four runs.
What Reporting App will cover
A separate surface to look at performance, not a tab inside the App, where the work of running events is enough. Designed for planning, comparing, and learning.
Financial reports
Gross revenue, net revenue, fees, refunds, and payouts broken down by event, edition, or date range.
Attendance reports
Sales vs gate, no-shows, capacity utilization by event.
Channel performance
Where your bookings come from, discovery, direct, share, search.
Audience insights
Repeat customers, lifetime value, audience segments.
Edition comparison
This year vs last year, this run vs the last, edition over edition.
Anomaly alerts
Get notified when something looks unusual, drop in sales, gate mismatch, spike in refunds.
Custom dashboards
Build views around what you actually need to see.
Cohort tracking
Follow groups of attendees over time across your events.
Exports
CSV, PDF, shareable links for your team or finance.
Join the Reporting App beta
Help shape what reporting looks like for partners. Existing webook PRO partners get priority access. Limited spots at launch.
Join the beta